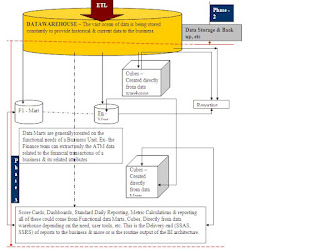

• The phase 1 of the diagram involves collecting the Transaction data from various operational data sources (ODS) that are deemed essential for records storage by the business.
• The data from all these various sources is extracted to one region for further manipulation. This is a very complex region where the data is brought on platform from various sources.
• Here the data may be extracted real time, hourly basis, daily, weekly monthly etc depending on the business need & other constraints.
• The phase 2 starts when all the data that is in the single platform is then made into a single format & made relevant in terms of removing all the inconsistency that may be prevailing.
• Again even this complex process is extremely important & is termed as data integration.
• Once the data is made consistent it is further normalized as per certain rules & standards of data warehousing & as required by the business.
• The data is stored constantly in the Data warehouse & is segregated in to different tables for relevance while storing.
• There are so many other complex processes involved here & in the previous phases, I wouldn’t be going deep into it.
• Once the data storage part is complete then comes the reporting part.
• Cubes are created for faster retrieval from the data warehouse & to view its multidimensionality.
• Data marts are created so that the relevant stakeholders can extract the data or do reporting from the data relevant only to their functional unit.
• Scorecards, Dashboards, & other reporting can be done directly from data warehouse or from data marts or from cubes as may be the need.
• The reporting part also involves a certain amount of analytics but most of this is very limited. Unless the end user is very well versed with the OLAP tool, data, analytics a very good outcome for supporting ad-hoc & complex business decisions become very difficult & most of the BI projects are not able to deliver this. This not only due to the tool but also due to several other factors. Thus versatility needed for the analytics team gets hampered & thereby the BI project outcome. All the million dollars go in a ditch.
4 comments:
Good one :).
Bhupendra
Interesting piece!
Nice one! very simple and very descriptive....the most complete thing in shortest possible description!
Interesting to know.
Post a Comment